NCrunch, My New Crush
This blog post is not about falling in love, being in love or love life in general. We fall in love now and then. Some love relations lasts a single night, some last longer, and even some lasts a lifetime. We fall in love, split up, find each other again, split up again, find someone else, and it all starts over again. You can put your money on multiple horses at once, but it is not recommendable though.
In the software business you get in touch with a large number of tools and technologies. Some gets dumped immediately, some stick around for a while and some even makes it into your toolbox. In contrast to your love life, you can have multiple tool and technology love relations at once, each serving their purpose.
In this post I’ll show off my latest score.
My New Crush
Years back I put my hands on this new continuous testing tool called NCrunch. I loved the idea and the perspectives. Unfortunately, I experienced some heavy performance issues, and had to uninstall the trial immediately. I dumped NCrunch. I forgot all about it. I made the conclusion that this was just another one of those tools who promised too much on the outside, and couldn’t live up to that. We have all been there. No big deal.
Years went by, I saw NCrunch named here and there, but always remembered how it had dragged down Visual Studio to its knees. Not for me.
Then a couple of months ago, I saw a Tweet by Damian Hickey saying that he was using NCrunch. Damian is one of my trusted sources when it comes to tools and technologies, so I thought why not give it another chance. I’d once fall in love with the ideas and concepts, time has passed, so there might have been some improvements.
And there has. This is not a complete feature full description of NCrunch, but more my personal usage and why I’ve fallen in love with this tool, and why it deserves a place in my toolbox.
Configuration
You can download a 30-day trial, and get access to all features. I’d recommend this, for both first-timers and old lovers. The first time you start up Visual Studio after installing NCrunch, you’re met with the configuration wizard. This is a brilliant piece of configuration. It lets your configure fine-grained details about how NCrunch should behave inside Visual Studio. Among other details, it lets you configure how to share the number of cores between NCrunch and Visual Studio.
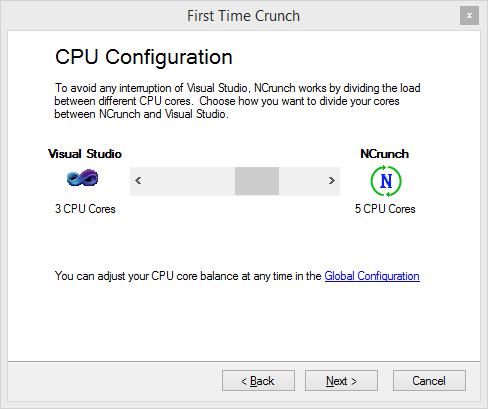
This is a huge improvement. There are other key performance optimizations you can do with the wizard, like the maximum number of processing threads, parallel test execution, etc.

The last configuration you should do, before sending NCrunch loose on your code, is to specify how NCrunch should act upon start. You can choose to either, run all tests, or disable all and then enable them manually. Depending on your application, you might consider going for the latter. Currently, I have NCrunch running on a solution with ~7000 unit tests, so it would stupid to make NCrunch run all tests every time I change a character. My advise is therefore, to optimize performance, disable NCrunch for all test, and then enable / disable depending on the system under test (SUT).
Let’s Go Testing
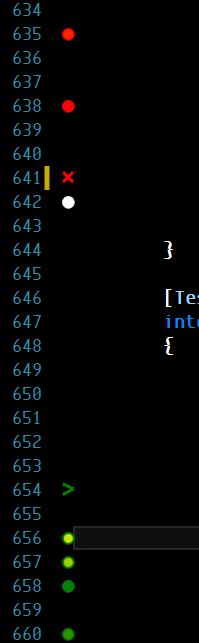
Once configured, and enabled (Ctrl+M, D), you’ll notice dots next to each line in your code. The dots are very important, and gives you immediate feedback about the testing state of each line. A white dot means that this line of code is not covered by any unit tests. Red means there is at least one failing test for that line. And, of course, a green dot indicate that all unit tests covering this line succeeds. A red cross indicates in which line a test is failing.
As I use this tool, I find myself not doing things I used to. I rarely or never run the application. I never run use the unit test runner. I even rarely compile my code. Well, I do sometimes, but that’s pretty much just old habits. The NCrunch build engine is much faster than the built-in. Tools like NCrunch changes the way you work to the better. This is efficient development.
Code Coverage
As you can tell by looking over the code, you will be given an indication of the code coverage of that particular unit of code, i.e. white dots means not coverage and red/green dots means coverage. This is very valuable. It means that you don’t need an extra tool (read license), or extra window, for telling you about the code coverage. Coverage is explicit, right next to your code, not in some percentage in a dialog somewhere. It gives you that immediate feedback that is so valuable. Code coverage in percentages is a management KPI. I want to see which lines that are not covered by any unit tests. Now. Inline in my code window.
Next to the line where a test is failing, there will be red cross. If you wanna navigate to the corresponding tests, the Ctrl+M, S shortcut will open a context menu to show you which tests covers that specific line.
If you wanna see the ‘usual’ full code coverage of your code base, this is possible through the NCrunch Metrics dialog.
Profiling
If we switch over to your unit tests, you’ll see the same dots as in your SUT. You’ll see whether the test is successful and a red cross indicates where in the test it is failing. In contrast to the dots in the SUT, these dots can have varying colors. These dots has a ring, indicating a ‘hot spot’, which means that the test is slow. If you hover your mouse over the dot, you’ll see how much time NCrunch took to execute that specific line. This is also a very useful feature. Instead of investing in an expensive profiling tool, NCrunch will give you this, inline in code.
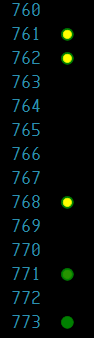
As it can be seen in the above, the code lines 761, 762, and 768 are ‘hot spots’ and have a significant execution time, while the lines 771 and 773, has less significant execution time.
Risk And Progress Bar
This is one little brilliant feature. The Risk and Progress bar (R&PB) keeps track of the overall status of how your coverage is and how you’re doing overall, in one compact overview.
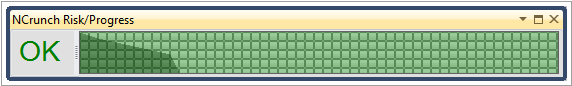
The R&PB consists of two components, a numerical indicator and a risk projection. If there is any failing tests, the numerical indicator would show the number. If there isn’t any failing tests, a risk percentage will indicate whether there might be tests that can fail given the current state of the solution. If it is a large solution with many long running tests, the risk percentage can indicate whether or not to make a commit to source control.
The risk projection serves two purposes, an overall status of the ongoing NCrunch processing, indicated by a progress bar, and a risk curve, indicated by a darker color, which shows the risk percentage at any time during processing.
Distributed Processing
This could become a real time saver. NCrunch can offload build and test processing to servers. For developer teams this is could be an awesome feature. Builds and tests can be processed concurrently on a number of other computers. It is even possible to offload the entire build and test work from the client. All that is required is a TCP connection to where the processing should be offloaded to.
Summary
As I’ve already outlined, I’m in love. NCrunch is not just a crush. NCrunch is love. As outlined in this post, NCrunch has quickly become an essential tool in my toolbox. I can’t imagine me writing any unit tests without anymore. I’d encourage any other unit test practitioner to give NCrunch a spin. I promise you, you’ll thank me afterwards.
Also as stated there is a 30-day trial, and I admit it, it is a rather expensive license, but it is worth every little penny.
Throw me comment below and share your experiences using NCrunch.
Tweetcomments powered by Disqus